 If you are a science news junkie, perhaps you saw it while scrolling through your news feed: the new Tree of Life. Last month, researchers announced that they’d used genetic sequences to build a much more inclusive picture of the Tree of Life. The tree is unique because it includes many microbial species that researchers have never even seen, let alone figured out how to grow in a lab. We know these lineages exclusively from broken up bits of DNA that the researchers culled from a wide variety of environments — from California meadows to geyser systems. Some of the DNA was even collected from the inside of dolphins’ mouths! The researchers fit those DNA bits together like a puzzle until they got the complete genomes of these mystery organisms and used that information to locate their branches on the tree. All of that is fascinating — but when you dig down and start looking at this new tree, you wouldn’t be faulted for wondering, “Uh, where’s the tree here?” The new Tree of Life, in fact, looks more like an exploding firework than an oak or an elm. Here, we’ll explore a tool that can help you interpret different styles of evolutionary trees (i.e., phylogenies) that you might see online, in textbooks, or in museum exhibits.
Where's the evolution?
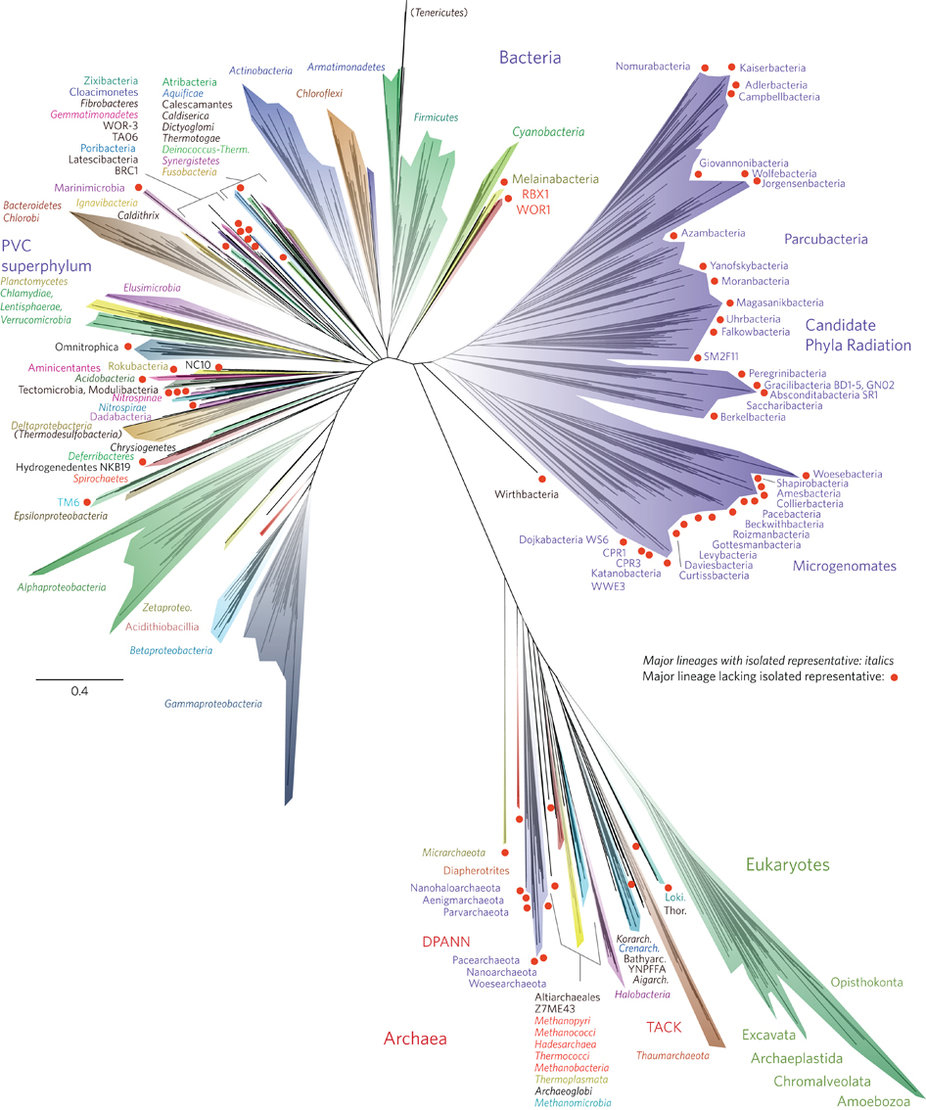
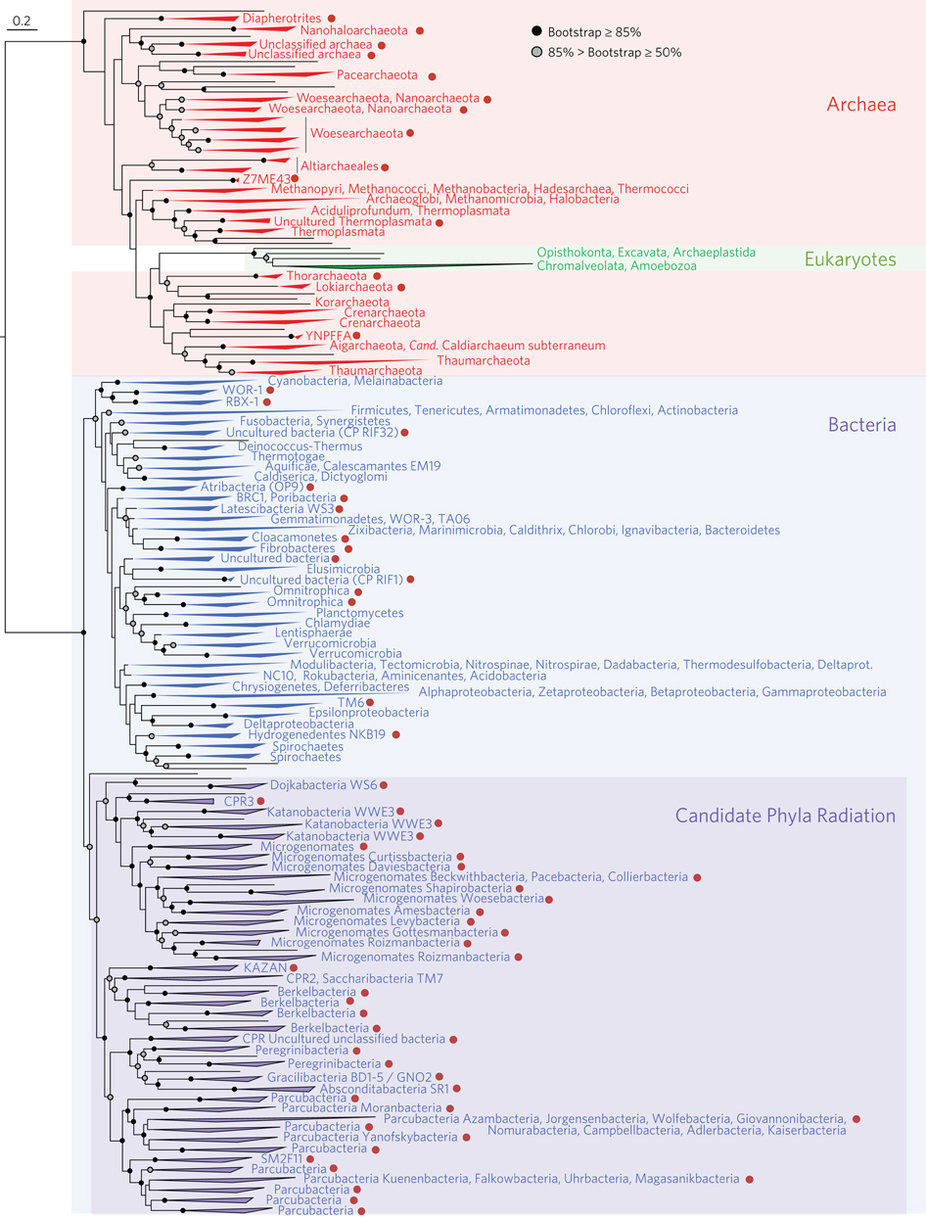
A glance at this new tree is likely to inspire many questions. Where’s the root of the tree? Why are some branches growing downwards? Why all those different colors? How come some branches are longer than others? What do the red dots mean? And most importantly, how can I tell which lineages are most closely related to one another?
 The Field Guide to Evolutionary Trees is an interactive feature that can help make sense of confusing trees. It’s part of Understanding Evolution’s new area devoted to phylogenetics called The Tree Room. Let’s use the Field Guide to interpret this new tree. You can follow along using the Field Guide for yourself if you like.
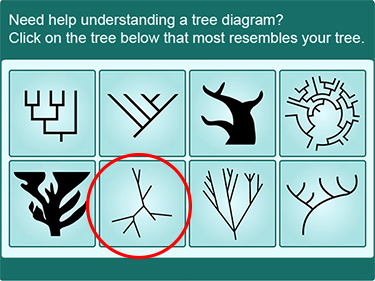
To use the Field Guide, first you’ll have to decide which tree style most closely resembles the new Tree of Life. All of the trees in the Field Guide (left) depict the same thing — evolutionary relationships — but they use different styles of line to do that, often resulting in trees that look quite different from one another but show the same information. The starburst-shaped tree (circled below) looks very similar to the new Tree of Life.
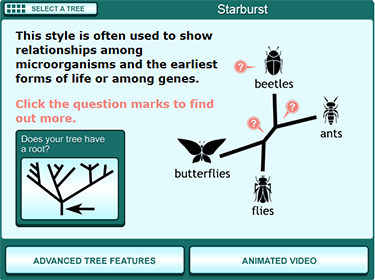
Clicking on the starburst tree leads you to a simple version of this tree type (right) that shows just four taxa. By clicking the buttons and question marks on this page, you can answer some important questions about the new Tree of Life, including:
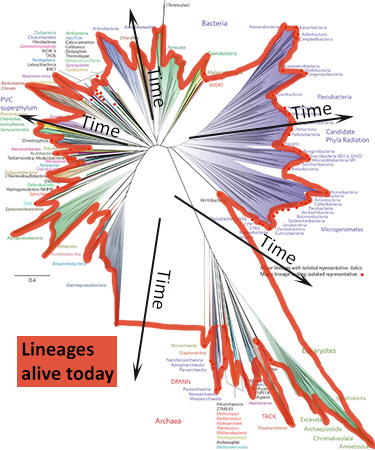
- Where is the root of the tree and why are some branches growing downwards? This tree doesn’t have a root because scientists are not sure which lineage is oldest and which lineage is least closely related to the others. The study that produced this tree was not designed to look for the root of the Tree of Life but to examine the diversity of life on Earth today. When a tree is unrooted, scientists often arrange the lineages arbitrarily in a starburst pattern to save space and to reinforce the message that they are not making a claim about where the root of the tree is. Even so, these trees are usually arranged so that the branches most likely to attach to the root are towards the center of the diagram (as shown below). On a starburst tree like this one, time generally flows from the center area of the tree outwards in all directions. Older, ancestral lineages connect with one another in the middle of the diagram.
-
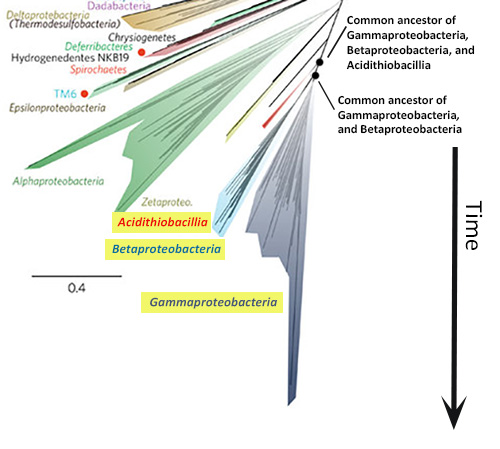
In starburst style trees, like the new Tree of Life, time generally flows from the center of the diagram outwards in all directions. How can I tell which lineages are most closely related to one another? To figure this out, you need to look at the points on the tree where two branches meet (i.e., the nodes of the tree). Nodes represent the common ancestors of lineages at the tips of the tree. The more recently two lineages share a common ancestor, the more closely related they are. So, for example, if you look at the left side of the new Tree of Life (shown at right), you’ll see that the Gammaproteobacteria and Betaproteobacteria are more closely related to each other than either is to the Acidithiobacillia because their most recent common ancestor is younger than the ancestor each shares with the Acidithiobacillia.
To answer the other questions about this tree, you’ll need to click on the “advanced tree features” button in the Field Guide. Then, by clicking on the question marks on this more complex tree, you can answer other questions about the new Tree of Life, including:
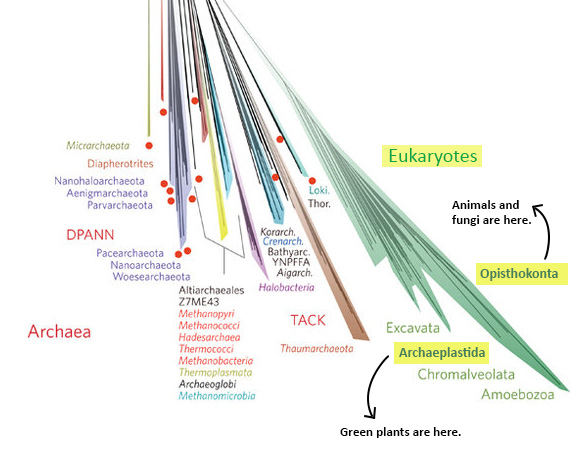
- Why all those different colors? On this tree, the colors designate different named groups. Just look for colors on the branches that match the font colors the names are written in. If you scan the perimeter of the tree, you’ll see many unfamiliar groups (Aenigmarchaeota, anyone?) and a few old friends — or enemies as the case may sometimes be (Amoebozoa, Chlamydiae!). Incidentally, all of plant, fungal, and animal life (including we humans) is represented by two thin slivers of the mint green Eukaryote branch in the lower right part of the diagram (shown below) — Opisthokonta (animals and fungi) and the Archaeoplastida (plants).
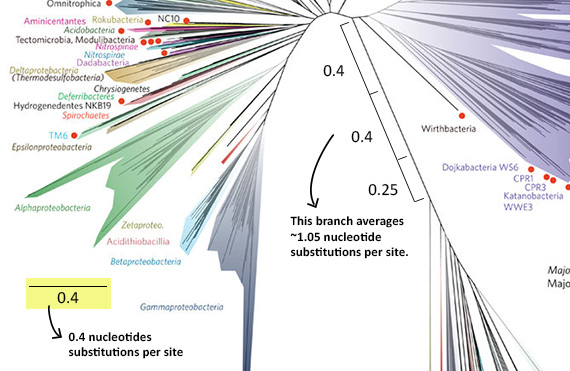
- Why are some branches longer than others? On this tree, branch length represents amount of evolutionary change as reflected in differences among the organisms’ DNA sequences. Along longer branches, more sequence change has occurred than along shorter branches. So, for example, the Eukaryote/DPANN/Archaea/TACK lineage sits at the end of a very long branch (as shown below). That means that there are many genetic differences between the organisms in this group and other organisms on the tree. To figure out exactly how much change is occurring, you’d have to use the scale bar, which reads 0.4, meaning that for each segment of branch of that length, 0.4 nucleotide substitutions per site occurred in the genes used to generate this tree.
Tree diagrams sometimes add labels or symbols to highlight particular features of the tree, in this case red dots. The caption for the tree in the original scientific paper describes what the red dots mean. Each of these dots represents a lineage that no scientist has ever actually seen and that is known only from DNA. In fact, the scientists working on this study discovered 1011 separate organisms this way! Many of these newly discovered lineages are thought to be symbionts — members of other species’ microbiomes. While this is impressive, it almost certainly represents a small portion of the microbial diversity still waiting to be discovered. For this study, DNA was collected from six very different environments, but this variation doesn’t come close to encompassing the full range of environments on Earth, nearly all of which are inhabited by different sorts of microbes. As scientists use genetic tools to dig deeper and deeper into the full scope of life’s diversity, they will surely be adding new explosions to this already lavish fireworks display! And as these new branches are grafted onto the tree and this information is displayed in different ways, you’ll be able to return to the Field Guide and Tree Room for help figuring out what it all means.
Primary literature:
- Hug, L. A., Baker, B. J., Anantharaman, K., Brown, C. T., Probst, A. J., Castelle, C. J., Butterfield, C. N., ...Banfield, J. F. (2015). A new view of the tree of life. Nature Microbiology 1: 16048 DOI 10.1038. Read it »
News articles:
- A summary of the new research from the New York Times
- A press release on the topic from UC Berkeley
Understanding Evolution resources:
Use the Field Guide to answer questions about this tree, which shows the same relationships depicted in the new Tree of Life, but in a different format.
- Which tree type most closely resembles the tree above?
- In what direction does evolutionary time flow on this tree?
- Which taxa are most closely related to Cyanobacteria (a member of the bacterial group that is light blue on this diagram)?
- Does this tree have any polytomies?
- What does varying branch width indicate on this tree?
- Advanced: This tree does not use numbers at branching points to indicate how confident scientists are in the relationships shown at that node. How is this represented instead on the tree?
- Teach basic tree thinking skills: This self-paced tutorial with quizzes from Laura Novick, Kefyn Catley, and Emily Schreiber is appropriate for college students and corrects many common misconceptions about evolutionary trees.
- Teach about building and using evolutionary trees: This lab for high school students from NovaLabs contains two main parts. In the first, students build phylogenetic trees themed around the evidence of evolution, including fossils, biogeography, and similarities in DNA. In the second, students explore an interactive tree of life and trace the shared ancestry of numerous species.
- Hug, L. A., Baker, B. J., Anantharaman, K., Brown, C. T., Probst, A. J., Castelle, C. J., Butterfield, C. N., ...Banfield, J. F. (2015). A new view of the tree of life. Nature Microbiology.1: 16048 DOI 10.1038.