Gillespie and Oxford used two main sources of data to test the Dispersal Hypothesis: proteins and DNA.
Data source #1: proteins
Individuals normally vary in the exact structure of their proteins, a set of molecules essential to all living things. You and your mom, for example, might carry Version A of a particular protein, while your cousin carries Version B of that protein. Furthermore, different populations have different protein versions and different frequencies of these versions. So perhaps in Thailand, there are six common versions of the protein (a high variation population), but in Peru, only one protein version is common (a low variation population).
Information on these protein version frequencies can be used to learn about dispersal rates. Imagine that people suddenly start immigrating and emigrating between Thailand and Peru. Pretty soon, the two populations will have about the same amount of variation — they’ll both have a mid-range level of variation. This means that if two populations have similar levels of variation, then there is probably a high rate of dispersal between them, but if they have very different levels of variation, then they are probably isolated.
Evaluating the evidence from proteins
The scientists’ study of proteins in the happy-face spiders revealed that different islands had very different levels of variation. This suggests that dispersal between the islands is not very common.
Data source #2: DNA
DNA is a molecule that carries genetic information from generation to generation in the form of a code. By comparing differences in the code’s sequence between individuals, it is possible to determine “who is more closely related to whom” — in general, the more similar the DNA sequences, the more closely related any two individuals or populations are and the less time they have been isolated. Gillespie and Oxford sampled DNA from different morphs on different islands and compared their sequences.
Evaluating the evidence from DNA
The DNA evidence suggested that the spider populations were related as this tree shows. All of the color morphs in one island population are more closely related to each other than they are to the color morphs from populations on other islands. For example, yellow morphs from a population on Hawaii are almost identical in DNA sequence to red front morphs from the same island, but are quite different from a yellow morph on Maui or Oahu.
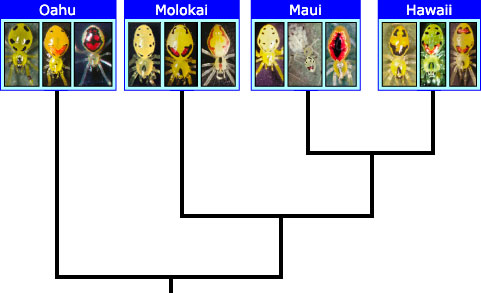
The tree suggests that the populations of spiders on different islands have been isolated from one another — in other words, that dispersal between islands is not very common. After all, if dispersal between islands were common, we would expect to find some spiders on Maui that were more closely related to some spiders on Hawaii than to other spiders on Maui.
Evaluating the Dispersal Hypothesis
What does the protein and DNA evidence say about the Dispersal Hypothesis, that dispersal of spiders between islands has caused a consistent ratio of 2 yellow:1 other on all four islands? Well, both lines of evidence point to the same answer: dispersal is not common, so the Dispersal Hypothesis is probably not a good one.
Gillespie and her colleagues needed to come up with an alternative hypothesis to explain the mysterious 2:1 ratio — but meanwhile, they noticed something striking about the tree they had produced.
Get tips for using research profiles, like this one, with your students.