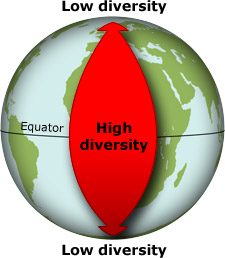
The pattern of having lots of species at the equator with diversity dwindling off towards the poles is known as the Latitudinal Diversity Gradient — “latitudinal” meaning how far north or south of the equator, “diversity” meaning the number of species, and “gradient” meaning the transition between high and low. We’ll just call this mouthful the LDG for short.

Before scientists try to explain a pattern, they need to convince themselves that there is a pattern — so the first question we’ll try to answer is …
Is the LDG real?
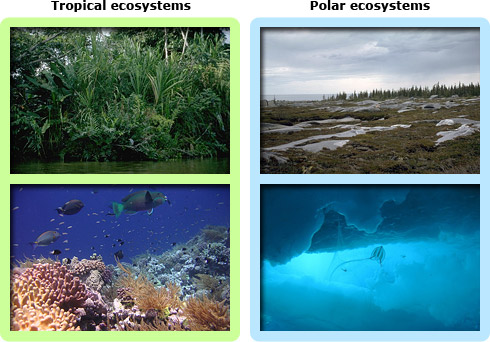
Compare these snapshots of typical ecosystems found in the tropics to those found in polar regions. There are lots of species in the tropical photos and far fewer in the polar pictures.

Based on these photos, the LDG sure seems to be real. In science, however, we can’t rely on impressions alone. Before we accept an idea, we need carefully collected evidence supporting that idea. What sort of data would it take to convince you that the LDG is real?
Question 1: Imagine that you are a scientist with a large database of information about different species: where they are found, their habitat types, other ecological information, classification information, population sizes, etc. You want to find out if the LDG is real.
A. What information in your database would you examine to find out if the LDG is real?
B. If you wanted to communicate this information to a colleague, how would you display it as a graph or chart? Sketch an imaginary version of the graph or chart, being sure to label the axes and types of data it displays.
